Diesen Artikel auf Deutsch lesen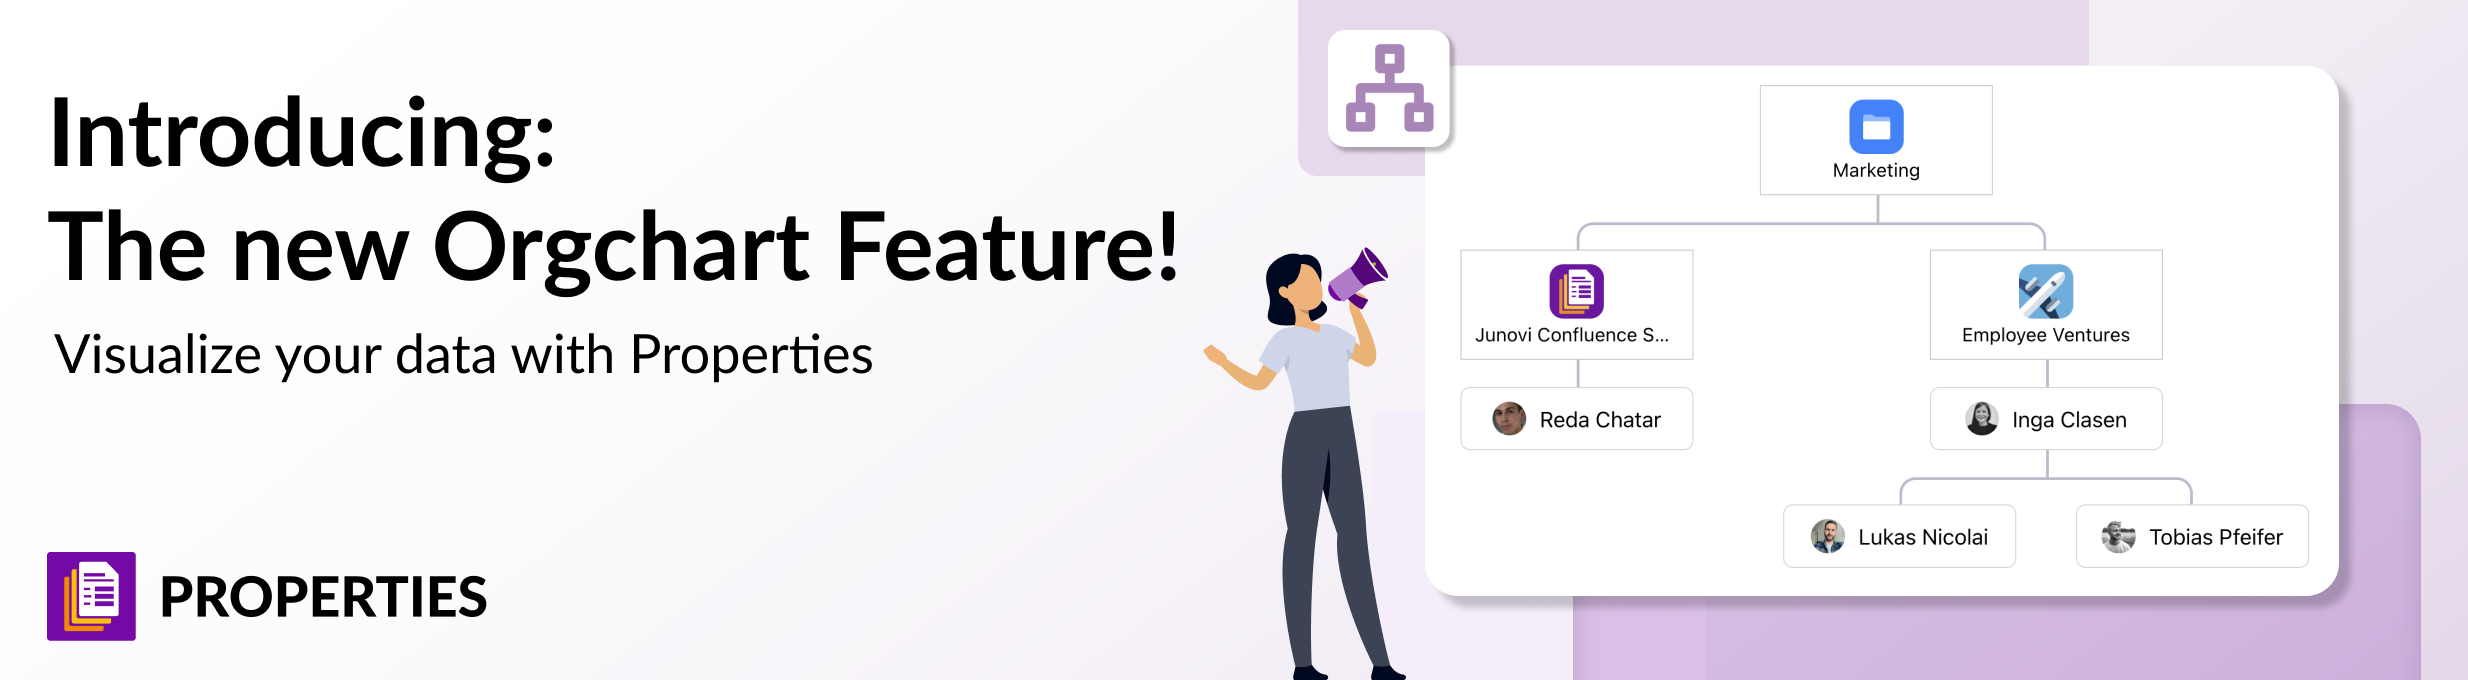
Ever wonder where you fit in?
Sorry, we should clarify; not in the big picture of life, we just meant where you or a colleague fits into the corporate hierarchy. Maybe you’d like to be able to not just visualize hierarchies and responsibilities, but have access to the real data behind it. “Good looks and personality” if you will.
If you’re a Confluence user, and we’re guessing you might be if you’re reading this article, the crafty developers at Junovi have recently added their latest brainchild to their Properties app - Property Group Visualization.
View and Access Your Org Chart Data
If you’re not familiar with Properties (you really should be you know), in a nutshell, it’s a Confluence app to create your own tables (in Confluence, known as properties). These tables are then filled with your customized fields allowing your users to capture everything from due dates, task owners, related pages, project statuses, and practically anything you’d need. These properties can then be embedded into your Confluence pages and templates.
Now with the Properties app, not only can you capture data, report, and filter on it, but also create charts and visualizations of your data, then drill down into that data, manipulate and rearrange it.
It’s Your Data - Visualize and Manipulate It!
Most visualizations, particularly hierarchical and organizational charts (“Org Charts”) are meant to be viewed, not interacted with. You can modify the chart when needed by manually clicking into it and making edits, but it isn’t “live”...it’s not tied to the actual data behind it. So when the information changes, and we all know how often data changes in today’s work environment, your charts are no longer reflective of the actual situation.
Properties changes this notion by giving you the ability to create data visualizations by - get this - using the actual data itself, not having to manually recreate it within a static chart. With Property Group Visualization, you now have the ability to build charts with your Confluence user fields and your own designed single-select fields. Structure and visualize responsibilities and hierarchies, create an overview of departments, hierarchies, or responsibilities, define contact persons, and then with a simple click of the mouse, jump to that property record.
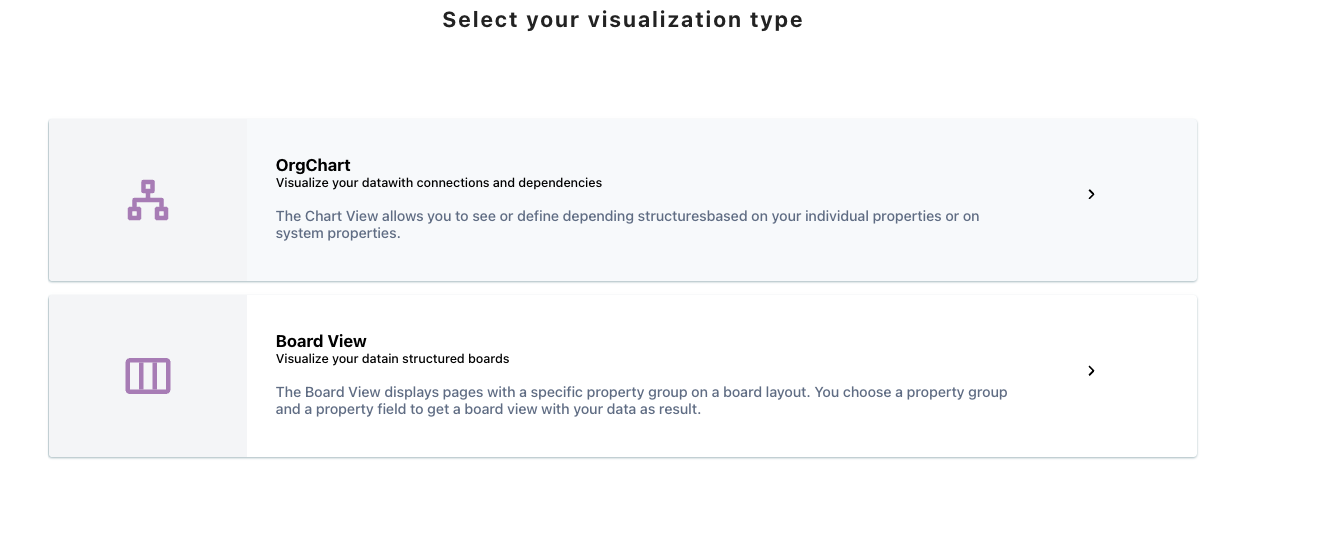
Choose your visualization type - OrgChart or Board View
Find Out for Yourself
We’re certain you’ll find immediate uses for Properties’ latest enhancements in your organization. Visualize your data like never before right in Confluence using your own data. The best way to find out, is to give it a try. Head over to the Atlassian Marketplace and install Properties - Templates, Metadata & Databases.
Further Reading
- Visualize organizational structures with Linchpin Intranet
- How to Organize Onboarding Documents in Confluence Cloud with Properties
- Simplify your Offboarding Processes with Templating.app – Easy Issues & Subtasks
- Easily Turn Any Jira Issue into a Template in Jira Cloud
- Motivate Your Employees and Organize Your Sales Incentive Program
- Keep Track of Your Team’s Goals and Objectives in Confluence Cloud


